
Hospitality Real Estate in Austin-Round Rock, TX
In Austin-Round Rock, TX, accommodation businesses (NAICS 721) had 465 establishments, 16,926 employees, and $638.2 million in annual payroll in 2023 CBP. Food services and drinking places had 5,486 establishments and $3.2 billion in payroll. See the Austin-Round Rock, TX market overview for population, total jobs, and the metro snapshot.
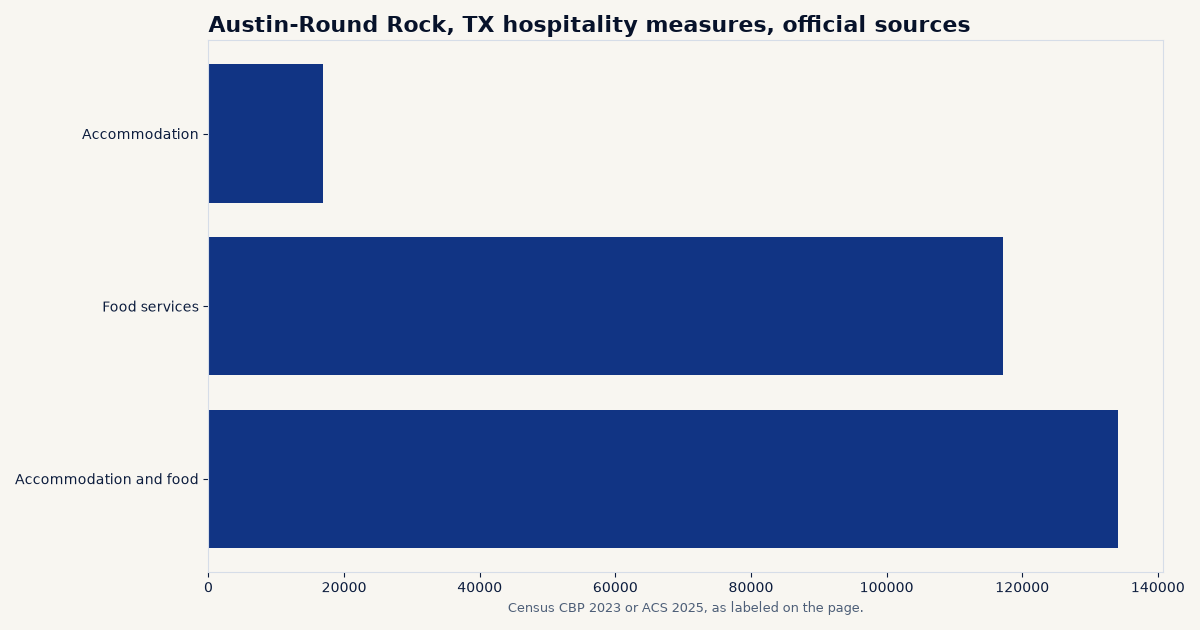
Rank among the 60 largest-population directory metros: #22 of 60 for hospitality employment (Census CBP 2023, 134,068 jobs).
What the public data show about hospitality in Austin-Round Rock, TX
This page reports CBP figures for accommodation (NAICS 721) and food services (NAICS 722) in Austin-Round Rock, TX, including establishments, employment, and annual payroll. There is no public hotel census or occupancy series in the files used here.
Establishments, employment, and payroll (Census CBP)
Austin-Round Rock, TX Hospitality Market Data
| Industry (NAICS) | Establishments, 2023 | Employment, 2023 | Annual payroll, 2023 | Employment change, 2022 to 2023 |
|---|---|---|---|---|
| Accommodation | 465 | 16,926 | $638.2 million | +12.6% |
| Food services and drinking places | 5,486 | 117,142 | $3.2 billion | +8.7% |
| Accommodation and food services | 5,951 | 134,068 | $3.9 billion | +9.2% |
Census County Business Patterns, 2023 and 2022, metro file. Annual payroll is converted from the survey's thousands of dollars. These are business counts and payrolls, not a property inventory.
Establishment size mix for Accommodation
| Employment size class | Establishments, 2023 |
|---|---|
| 1 to 4 employees | 142 |
| 5 to 9 | 59 |
| 10 to 19 | 90 |
| 20 to 49 | 114 |
| 50 to 99 | 27 |
| 100 to 249 | 23 |
| 250 to 499 | 5 |
| 500 to 999 | 4 |
Census County Business Patterns 2023 metro file, disclosed size classes only. Classes with zero establishments are omitted.
Detail by industry group
| Industry group (CBP 2023) | Establishments | Employment | Annual payroll |
|---|---|---|---|
| Traveler accommodation | 397 | 16,483 | $622.5 million |
| RV parks and recreational camps | 41 | 249 | $7.8 million |
| Rooming and boarding houses, dormitories, and workers' camps | 27 | 194 | $8.0 million |
| Special food services | 665 | 9,156 | $297.5 million |
| Drinking places (alcoholic beverages) | 404 | 6,619 | $180.4 million |
| Restaurants and other eating places | 4,417 | 101,367 | $2.8 billion |
Census County Business Patterns 2023 metro file, industry groups under the property-type NAICS listed above. Annual payroll is converted from the survey's thousands of dollars.
Compared with the U.S. and peer metros
In 2023, Austin-Round Rock, TX accounted for 0.86% of U.S. CBP employment in Accommodation. Annual CBP payroll per establishment was about $1,372,574 here, compared with $1,150,007 in the 50-state and D.C. total.
| Peer metro (overview) | Accommodation establishments, 2023 | Annual payroll, 2023 |
|---|---|---|
| Portland-Vancouver, OR | 414 | $404.6 million |
| Sacramento-Roseville, CA | 348 | $680.5 million |
| San Antonio-New Braunfels, TX | 568 | $553.0 million |
| St. Louis, MO | 404 | $386.7 million |
Peer metros are other directory markets with similar 2025 population. CBP figures use the same NAICS code as the lead series on this page. Links go to each metro overview.
Related pages
Return to the Austin-Round Rock, TX market overview for population, total private jobs, rents, and the metro snapshot. National context: U.S. hospitality market data. Full directory: 120 U.S. metros.
Frequently asked questions
Does this page report hospitality vacancy or asking rents in Austin-Round Rock, TX?
No. Free federal sources used here do not report hospitality vacancy or asking rents for Austin-Round Rock, TX. This page reports County Business Patterns establishments, employment, and payroll for the hospitality-related NAICS codes listed below.
How is Accommodation measured?
Census County Business Patterns for 2023 reports establishments, employment, and annual payroll for that NAICS class in the Austin-Round Rock, TX metro. When a cell is suppressed, the page shows an estimate from the U.S. sector share and labels it estimated.
Where is the rest of the Austin-Round Rock, TX market?
Start with the Austin-Round Rock, TX market overview. National context is on the U.S. hospitality market data page. The 120-metro directory is at /markets/metros/.
What stands out in this market
The Austin-Round Rock-San Marcos, TX metropolitan statistical area, spanning five Texas counties, ranks 25th nationally in population with 2,620,945 residents as of 2025. Between 2020 and 2025, the metro expanded by 320,773 residents, a 13.95% increase, according to U.S. Census Bureau population estimates. Growth continued in 2025 with net migration adding 37,317 residents, comprising 19,860 domestic and 17,457 international arrivals, alongside 16,621 from natural increase. Local commercial activity is supported by a large labor base of 1,306,122 covered workers across 76,682 establishments. Private sector employment accounts for 1,113,111 jobs across 75,886 establishments. Key employment drivers include retail trade with 119,702 workers across 6,335 establishments, construction with 86,554 jobs across 6,189 establishments, manufacturing with 84,155 jobs across 2,288 establishments, and wholesale trade with 47,690 jobs. Information technology contributes 42,386 positions, while transportation and warehousing employ 31,928 and 5,657 workers, respectively. Broader construction activity in the metro has shifted following peak permitting volume in 2021, when total permitted residential units reached 50,907 valued at $9.10 billion. By 2025, total residential permits moderated to 27,322 units valued at $6.25 billion, with single-family permits accounting for 14,810 units and multi-family structures with five or more units totaling 11,749 units. Economic conditions remain bolstered by high earning power, with a median household income of $102,427 compared to the national benchmark of $84,780.
Sources and data notes
- U.S. Census Bureau, County Business Patterns, 2023 and 2022. Metro file for local figures. U.S. comparison totals are the sum of all-legal-form state rows for the 50 states and the District of Columbia.
- Method details and limits are collected on the methodology page. Questions can be sent to richard@familyoffices.com.
Educational disclaimer
This page is for education only. It is not legal, tax, investment, or brokerage advice, and it is not an offer to buy, sell, or finance real estate or securities. CommercialRealEstate.com does not list properties and does not represent buyers or sellers. Questions about this data can be sent to richard@familyoffices.com.