
Office Real Estate in Richmond, VA
In Richmond, VA, lessors of nonresidential buildings (NAICS 531120) had 111 establishments, 454 employees, and $35.0 million in annual payroll in the 2023 County Business Patterns. Professional services payroll was $3.6 billion. Administrative and support employment was 35,466. See the Richmond, VA market overview for population, total jobs, and the metro snapshot.
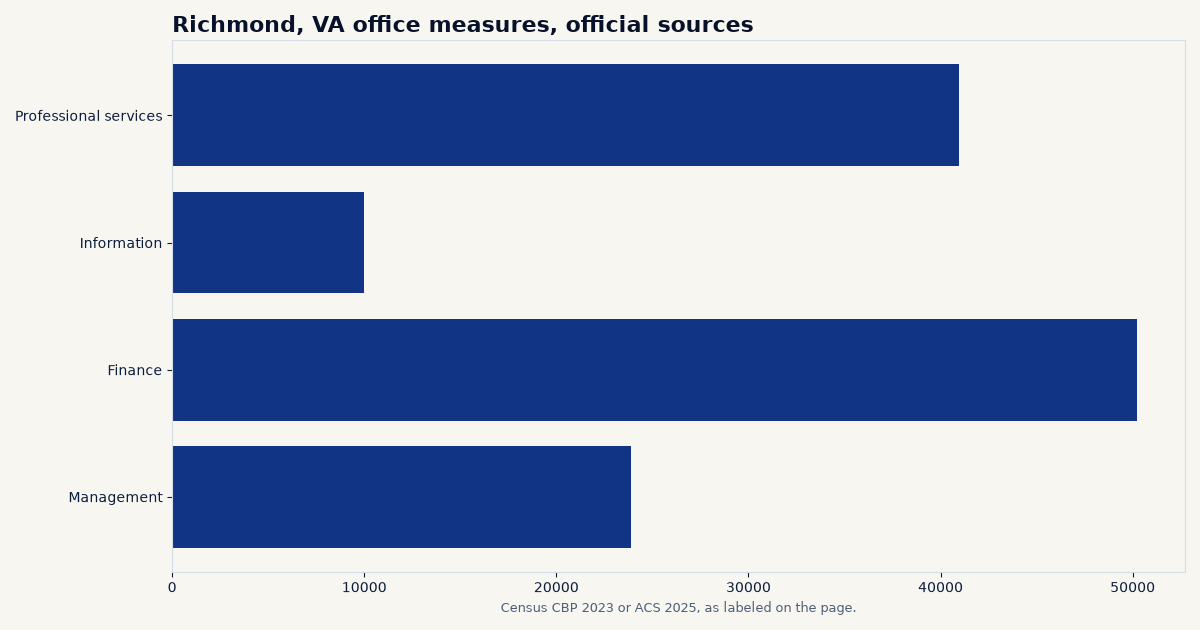
Rank among the 60 largest-population directory metros: #41 of 60 for office-using employment (Census CBP 2023, 171,465 jobs).
What the public data show about office in Richmond, VA
This page reports County Business Patterns figures that are specific to office-using activity in Richmond, VA: lessors of nonresidential buildings (NAICS 531120) and sectors 51 through 56, including establishments, employment, and annual payroll. Free federal sources used here do not publish an office inventory, vacancy rate, or asking rents.
Establishments, employment, and payroll (Census CBP)
Richmond, VA Office Market Data
| Industry (NAICS) | Establishments, 2023 | Employment, 2023 | Annual payroll, 2023 | Employment change, 2022 to 2023 |
|---|---|---|---|---|
| Lessors of nonresidential buildings | 111 | 454 | $35.0 million | +7.3% |
| Information | 536 | 10,004 | $918.1 million | +1.5% |
| Finance and insurance | 1,959 | 50,214 | $7.3 billion | +0.8% |
| Real estate and rental and leasing | 1,928 | 10,951 | $833.0 million | +3.5% |
| Professional, scientific, and technical services | 3,963 | 40,955 | $3.6 billion | -2.9% |
| Management of companies and enterprises | 234 | 23,875 | $2.5 billion | +5.0% |
| Administrative and support and waste management and remediation services | 1,962 | 35,466 | $1.8 billion | -3.0% |
| Office-using sectors 51-56 combined (CBP) | 10,582 | 171,465 | $17.0 billion | n/a |
Census County Business Patterns, 2023 and 2022, metro file. Annual payroll is converted from the survey's thousands of dollars. These are business counts and payrolls, not a property inventory.
Establishment size mix for Lessors of nonresidential buildings
| Employment size class | Establishments, 2023 |
|---|---|
| 1 to 4 employees | 89 |
| 5 to 9 | 11 |
| 10 to 19 | 7 |
| 20 to 49 | 3 |
Census County Business Patterns 2023 metro file, disclosed size classes only. Classes with zero establishments are omitted.
Compared with the U.S. and peer metros
In 2023, Richmond, VA accounted for 0.26% of U.S. CBP employment in Lessors of nonresidential buildings. Annual CBP payroll per establishment was about $315,514 here, compared with $422,509 in the 50-state and D.C. total. CBP counted 111 lessors of nonresidential buildings in Richmond, VA in 2023.
| Peer metro (overview) | Lessors of nonresidential buildings establishments, 2023 | Annual payroll, 2023 |
|---|---|---|
| Louisville/Jefferson County, KY | 130 | $34.7 million |
| Memphis, TN | 102 | $49.2 million |
| Salt Lake City-Murray, UT | 159 | $85.3 million |
| Oklahoma City, OK | 143 | $25.3 million |
Peer metros are other directory markets with similar 2025 population. CBP figures use the same NAICS code as the lead series on this page. Links go to each metro overview.
Related pages
Return to the Richmond, VA market overview for population, total private jobs, rents, and the metro snapshot. National context: U.S. office market data. Full directory: 120 U.S. metros.
Frequently asked questions
Does this page report office vacancy or asking rents in Richmond, VA?
No. Free federal sources used here do not report office vacancy or asking rents for Richmond, VA. This page reports County Business Patterns establishments, employment, and payroll for the office-related NAICS codes listed below.
How is Lessors of nonresidential buildings measured?
Census County Business Patterns for 2023 reports establishments, employment, and annual payroll for that NAICS class in the Richmond, VA metro. When a cell is suppressed, the page shows an estimate from the U.S. sector share and labels it estimated.
Where is the rest of the Richmond, VA market?
Start with the Richmond, VA market overview. National context is on the U.S. office market data page. The 120-metro directory is at /markets/metros/.
What stands out in this market
The Richmond, VA metropolitan area spans 17 counties in Virginia and ranks as the 44th largest metro in the United States by population. Between 2020 and 2025, the metro expanded by 5.52%, adding 72,655 residents to reach a total population of 1,389,338. Growth in 2025 was propelled by strong migration, including 7,543 net domestic migrants and 5,387 international migrants, alongside natural growth of 1,697. The local economy is backed by solid household fundamentals, featuring a median household income of $92,800, well above the national median of $84,780. Demand for office space is closely tied to the region's white-collar employment base and overall private sector footprint. According to employment figures aggregated by county sums, the Richmond metro supports 668,060 total covered jobs across 44,451 establishments, with 554,520 of those positions in the private sector. Office-occupying and related sectors include finance with 25,101 employees across 2,223 establishments, wholesale trade with 17,539 jobs, and the information sector with 3,084 jobs across 602 establishments. Construction also represents a substantial share of local business activity, employing 41,515 workers across 3,676 establishments.
Sources and data notes
- U.S. Census Bureau, County Business Patterns, 2023 and 2022. Metro file for local figures. U.S. comparison totals are the sum of all-legal-form state rows for the 50 states and the District of Columbia.
- Method details and limits are collected on the methodology page. Questions can be sent to richard@familyoffices.com.
Educational disclaimer
This page is for education only. It is not legal, tax, investment, or brokerage advice, and it is not an offer to buy, sell, or finance real estate or securities. CommercialRealEstate.com does not list properties and does not represent buyers or sellers. Questions about this data can be sent to richard@familyoffices.com.