
Retail Real Estate in San Diego-Chula Vista, CA
In San Diego-Chula Vista, CA, CBP 2023 counted 9,207 retail trade establishments, 147,017 employees, and $6.2 billion in annual payroll. Employment was +0.8% from 2022. See the San Diego-Chula Vista, CA market overview for population, total jobs, and the metro snapshot.
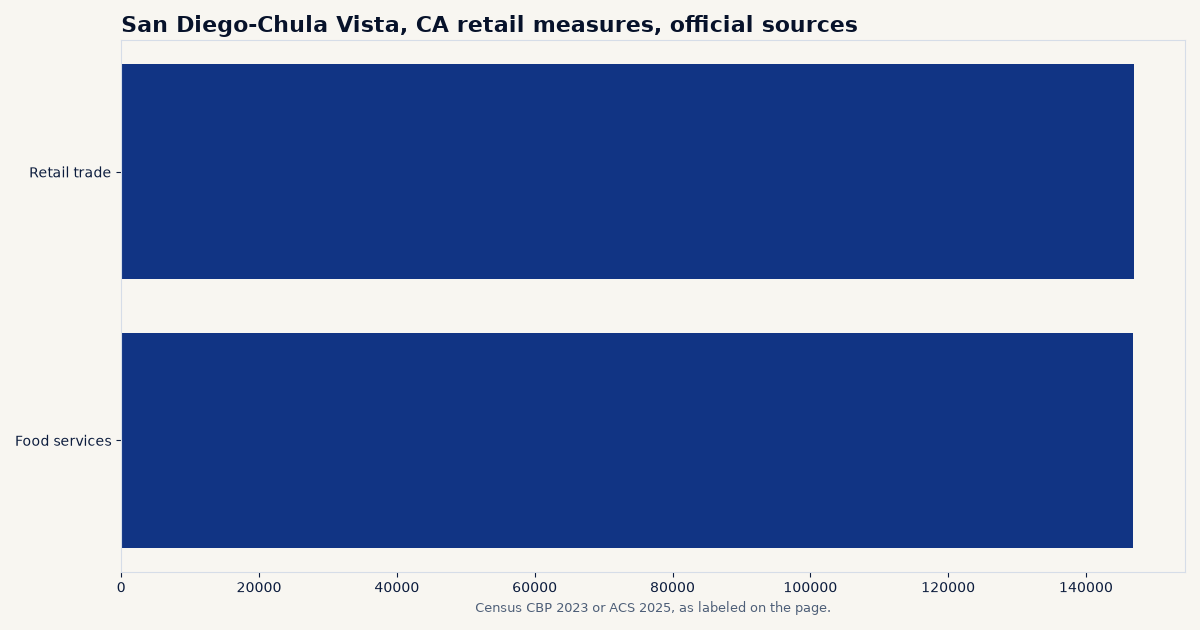
Rank among the 60 largest-population directory metros: #20 of 60 for retail employment (Census CBP 2023, 147,017 jobs).
What the public data show about retail in San Diego-Chula Vista, CA
This page reports Census County Business Patterns figures for retail trade in San Diego-Chula Vista, CA, including establishments, employment, annual payroll, and the size mix of those establishments when disclosed. The files used here do not count retail square footage or shop vacancy.
Establishments, employment, and payroll (Census CBP)
| Industry (NAICS) | Establishments, 2023 | Employment, 2023 | Annual payroll, 2023 | Employment change, 2022 to 2023 |
|---|---|---|---|---|
| Retail trade | 9,207 | 147,017 | $6.2 billion | +0.8% |
Census County Business Patterns, 2023 and 2022, metro file. Annual payroll is converted from the survey's thousands of dollars. These are business counts and payrolls, not a property inventory.
Establishment size mix for Retail trade
| Employment size class | Establishments, 2023 |
|---|---|
| 1 to 4 employees | 4,059 |
| 5 to 9 | 2,059 |
| 10 to 19 | 1,467 |
| 20 to 49 | 972 |
| 50 to 99 | 391 |
| 100 to 249 | 207 |
| 250 to 499 | 47 |
| 500 to 999 | 4 |
Census County Business Patterns 2023 metro file, disclosed size classes only. Classes with zero establishments are omitted.
Detail by industry group
| Industry group (CBP 2023) | Establishments | Employment | Annual payroll |
|---|---|---|---|
| Motor vehicle and parts dealers | 943 | 17,048 | $1.3 billion |
| Furniture and home furnishings retailers | 408 | 3,906 | $181.0 million |
| Electronics and appliance retailers | 181 | 2,161 | $97.5 million |
| Building material and garden equipment and supplies dealers | 474 | 10,880 | $447.7 million |
| Food and beverage retailers | 1,517 | 32,935 | $1.2 billion |
| Health and personal care retailers | 839 | 11,429 | $583.1 million |
| Gasoline stations | 572 | 5,099 | $166.2 million |
| Clothing and clothing accessories retailers | 1,340 | 20,547 | $572.7 million |
| Sporting goods, hobby, musical instrument, book, and miscellaneous retailers | 458 | 4,872 | $149.9 million |
| General merchandise retailers | 245 | 21,526 | $767.2 million |
| Miscellaneous store retailers | 1,097 | 8,256 | $271.8 million |
| Nonstore retailers | 1,133 | 8,358 | $562.2 million |
Census County Business Patterns 2023 metro file, industry groups under the property-type NAICS listed above. Annual payroll is converted from the survey's thousands of dollars.
Compared with the U.S. and peer metros
In 2023, San Diego-Chula Vista, CA accounted for 0.92% of U.S. CBP employment in Retail trade. Annual CBP payroll per establishment was about $675,810 here, compared with $580,498 in the 50-state and D.C. total.
| Peer metro (overview) | Retail trade establishments, 2023 | Annual payroll, 2023 |
|---|---|---|
| Tampa-St. Petersburg, FL | 10,673 | $6.3 billion |
| Denver-Aurora, CO | 8,583 | $6.3 billion |
| Orlando-Kissimmee, FL | 9,017 | $5.5 billion |
| Charlotte-Concord, NC | 8,197 | $5.2 billion |
Peer metros are other directory markets with similar 2025 population. CBP figures use the same NAICS code as the lead series on this page. Links go to each metro overview.
Related pages
Return to the San Diego-Chula Vista, CA market overview for population, total private jobs, rents, and the metro snapshot. National context: U.S. retail market data. Full directory: 120 U.S. metros.
Frequently asked questions
Does this page report retail vacancy or asking rents in San Diego-Chula Vista, CA?
No. Free federal sources used here do not report retail vacancy or asking rents for San Diego-Chula Vista, CA. This page reports County Business Patterns establishments, employment, and payroll for the retail-related NAICS codes listed below.
How is Retail trade measured?
Census County Business Patterns for 2023 reports establishments, employment, and annual payroll for that NAICS class in the San Diego-Chula Vista, CA metro. When a cell is suppressed, the page shows an estimate from the U.S. sector share and labels it estimated.
Where is the rest of the San Diego-Chula Vista, CA market?
Start with the San Diego-Chula Vista, CA market overview. National context is on the U.S. retail market data page. The 120-metro directory is at /markets/metros/.
What stands out in this market
The San Diego-Chula Vista-Carlsbad metro area in California ranks 18th nationally in population, with 3,282,248 residents across its single county. Population contracted slightly by 0.57 percent, or 18,862 residents, between 2020 and 2025 according to U.S. Census Bureau Vintage 2025 estimates. In 2025, natural population growth of 12,462 and international migration of 6,132 were offset by a net domestic migration loss of 23,876, resulting in a net migration decline of 17,744. Despite these population shifts, local consumer purchasing power remains supported by a median household income of $110,941, well above the national median of $84,780. Local commercial activity is backed by a broad private employment base of 1,288,378 workers across 133,287 establishments. Retail real estate directly serves an industry employing 134,936 people across 8,795 retail establishments. Other major private employment sectors include manufacturing with 109,768 jobs, construction with 88,510 jobs, wholesale trade with 40,178 jobs, transportation with 36,889 jobs, information with 17,572 jobs, and warehousing with 7,046 jobs. Residential growth also shapes local retail trade corridors. Total building permits reached 11,707 units in 2025, valued at over $2.5 billion, with multifamily development leading activity at 7,311 units in 5-plus unit structures. The market features 1,287,538 total housing units, a 45.48 percent renter share, and a rental vacancy rate of 4.56 percent compared to 5.94 percent nationally. Median gross rent sits at $2,416 and median home values stand at $927,700, reflecting strong underlying real estate values across the metro.
Sources and data notes
- U.S. Census Bureau, County Business Patterns, 2023 and 2022. Metro file for local figures. U.S. comparison totals are the sum of all-legal-form state rows for the 50 states and the District of Columbia.
- Method details and limits are collected on the methodology page. Questions can be sent to richard@familyoffices.com.
Educational disclaimer
This page is for education only. It is not legal, tax, investment, or brokerage advice, and it is not an offer to buy, sell, or finance real estate or securities. CommercialRealEstate.com does not list properties and does not represent buyers or sellers. Questions about this data can be sent to richard@familyoffices.com.