
Apartment pipeline: permits, starts & completions
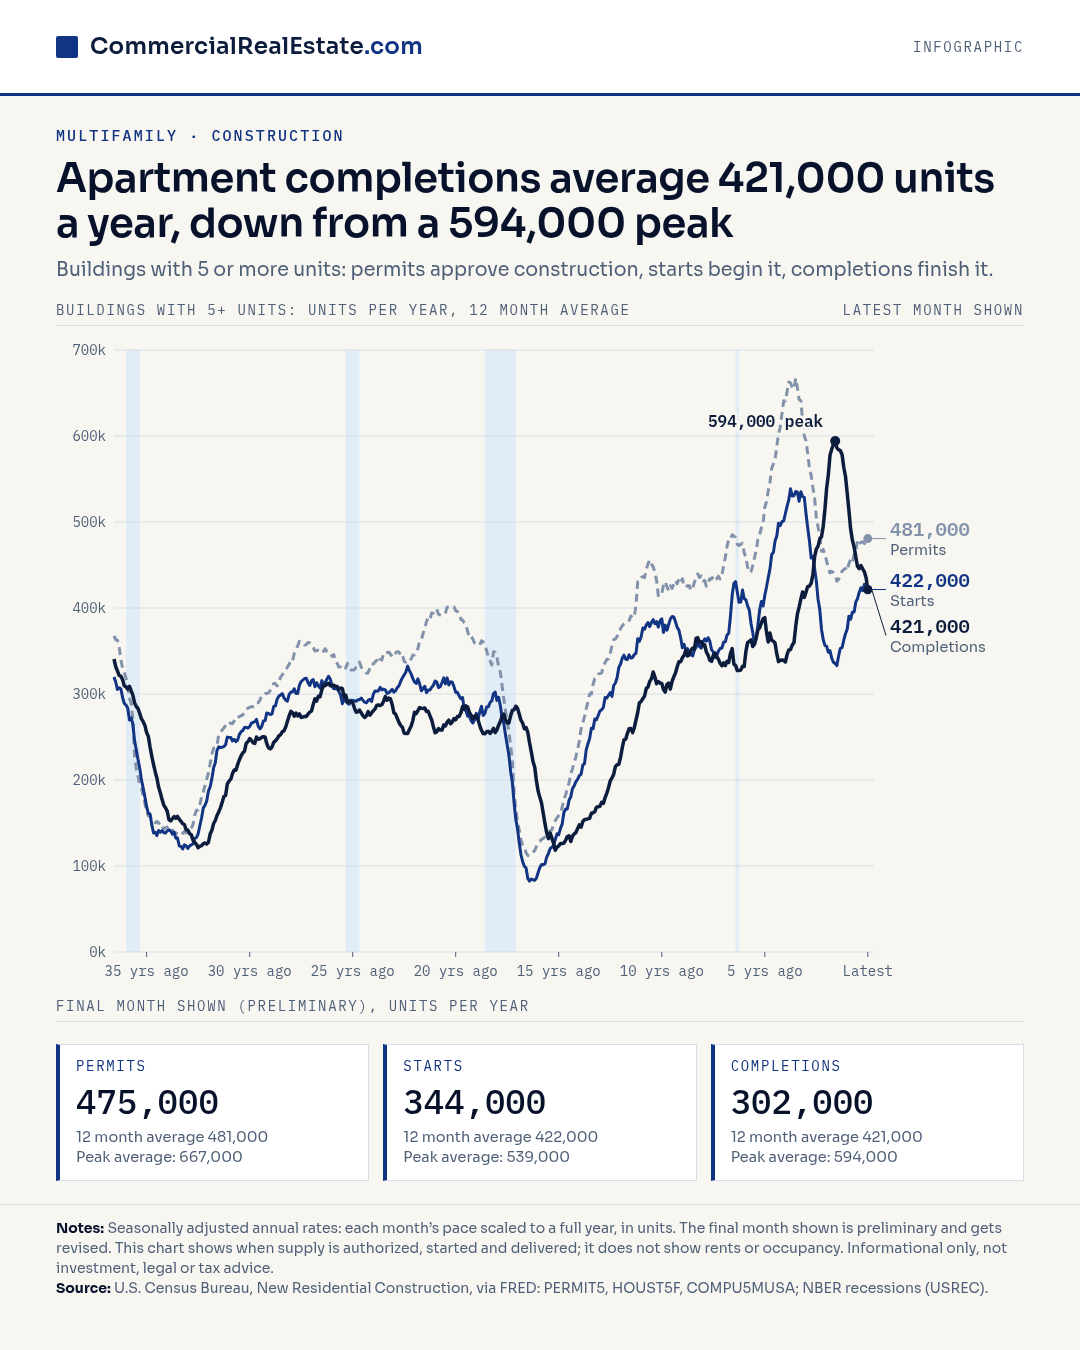
Completions of buildings with 5 or more units run at 421,000 a year on the latest 12 month average, down from 594,000 at the peak shown. In the latest month shown, permits were 475,000, starts 344,000 and completions 302,000 at an annual rate.
Data table
The table lists the latest 24 of 440 rows. The full series is in the CSV download.
| Month | Permits (units per year) | Starts (units per year) | Completions (units per year) | Permits, 12 month average | Starts, 12 month average | Completions, 12 month average |
|---|---|---|---|---|---|---|
| Month 417 | 398,000 | 291,000 | 663,000 | 446,000 | 349,000 | 555,000 |
| Month 418 | 421,000 | 397,000 | 659,000 | 441,000 | 350,000 | 578,000 |
| Month 419 | 489,000 | 275,000 | 580,000 | 442,000 | 341,000 | 585,000 |
| Month 420 | 424,000 | 408,000 | 564,000 | 441,000 | 337,000 | 590,000 |
| Month 421 | 425,000 | 328,000 | 625,000 | 438,000 | 336,000 | 594,000 |
| Month 422 | 409,000 | 369,000 | 519,000 | 431,000 | 333,000 | 586,000 |
| Month 423 | 469,000 | 393,000 | 484,000 | 433,000 | 344,000 | 584,000 |
| Month 424 | 461,000 | 429,000 | 497,000 | 437,000 | 353,000 | 583,000 |
| Month 425 | 460,000 | 324,000 | 465,000 | 443,000 | 354,000 | 578,000 |
| Month 426 | 475,000 | 430,000 | 435,000 | 445,000 | 363,000 | 563,000 |
| Month 427 | 461,000 | 453,000 | 442,000 | 446,000 | 370,000 | 553,000 |
| Month 428 | 427,000 | 407,000 | 470,000 | 443,000 | 375,000 | 534,000 |
| Month 429 | 498,000 | 471,000 | 426,000 | 452,000 | 390,000 | 514,000 |
| Month 430 | 477,000 | 355,000 | 398,000 | 456,000 | 387,000 | 492,000 |
| Month 431 | 448,000 | 375,000 | 421,000 | 453,000 | 395,000 | 479,000 |
| Month 432 | 537,000 | 410,000 | 470,000 | 462,000 | 395,000 | 471,000 |
| Month 433 | 463,000 | 469,000 | 485,000 | 465,000 | 407,000 | 459,000 |
| Month 434 | 561,000 | 414,000 | 386,000 | 478,000 | 411,000 | 448,000 |
| Month 435 | 419,000 | 481,000 | 455,000 | 474,000 | 418,000 | 446,000 |
| Month 436 | 491,000 | 494,000 | 540,000 | 476,000 | 424,000 | 449,000 |
| Month 437 | 468,000 | 282,000 | 418,000 | 477,000 | 420,000 | 446,000 |
| Month 438 | 449,000 | 519,000 | 394,000 | 475,000 | 428,000 | 442,000 |
| Month 439 | 482,000 | 444,000 | 359,000 | 477,000 | 427,000 | 435,000 |
| Month 440 | 475,000 | 344,000 | 302,000 | 481,000 | 422,000 | 421,000 |
Text version of the graphic
Apartment completions average 421,000 units a year, down from a 594,000 peak.
Buildings with 5 or more units: permits approve construction, starts begin it, completions finish it.
Latest month shown (preliminary), units per year: permits 475,000, starts 344,000, completions 302,000.
Permits: 12 month average 481,000; series high 667,000.
Starts: 12 month average 422,000; series high 539,000.
Completions: 12 month average 421,000; series high 594,000.
Notes: Seasonally adjusted annual rates: each month’s pace scaled to a full year, in units. The final month shown is preliminary and gets revised. This chart shows when supply is authorized, started & delivered; it does not show rents or occupancy.
How to read this graphic
Read the lines as a pipeline with a lag. Permits approve a building, and starts follow once financing and ground are ready. Permits at a 12 month average of 481,000 units a year sit above starts at 422,000, so some approvals have not turned into construction. Completions at 421,000 sit well below the 594,000 high set earlier in the series. A sponsor underwriting a lease-up can use that gap to judge how much new supply may reach the market while the business plan for a deal is being executed.
Watch the final month too. Starts of 344,000 and completions of 302,000 in the last month both run below their 12 month averages of 422,000 and 421,000. Because the latest reading is preliminary, treat it as a prompt to check the next release before changing a supply assumption.
What the graphic does not show
The graphic shows the timing of supply for buildings with 5 or more units. It says nothing about rents or occupancy, and a national total cannot tell a sponsor whether one submarket is oversupplied. Rates are seasonally adjusted and scaled to a full year, so a single month, such as the 302,000 completions reading, can look larger or smaller than the pace it sustains. The latest month is preliminary and gets revised. Informational only.