
Three tests that cap loan proceeds: LTV, DSCR, debt yield
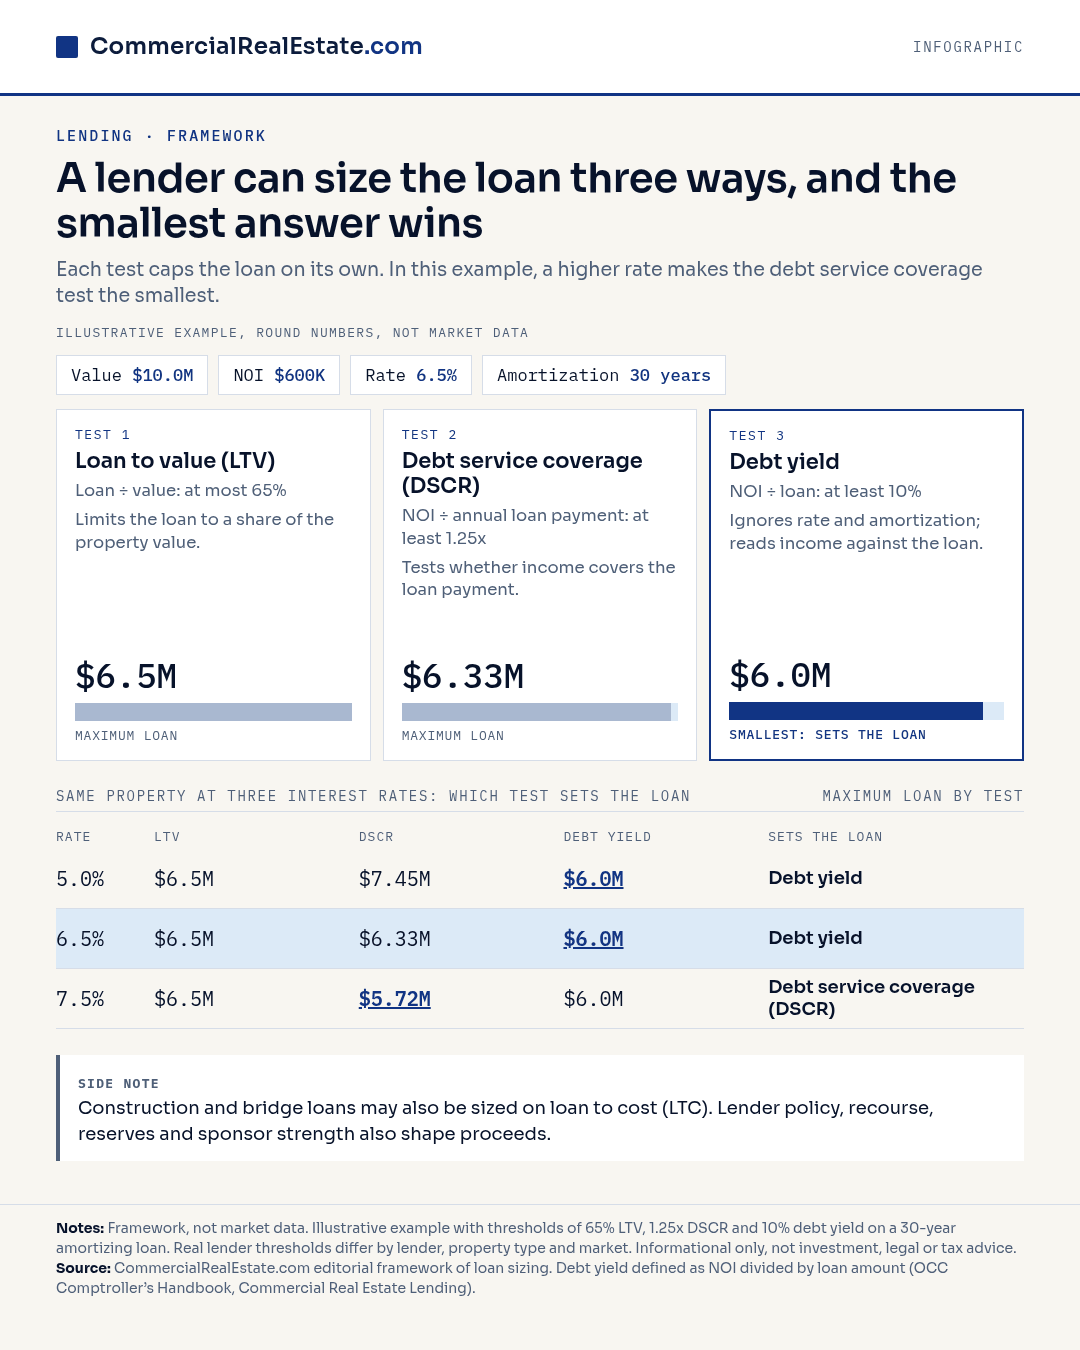
In the illustrative example, the three tests allow $6.5M (LTV), $6.33M (DSCR) and $6.0M (debt yield) at a 6.5% rate, so the debt yield test sets the loan. At 7.5%, the debt service coverage (dscr) test binds.
Data table
| Interest rate | LTV test: maximum loan | DSCR test: maximum loan | Debt yield test: maximum loan | Test that sets the loan |
|---|---|---|---|---|
| 5.0% | $6.5M | $7.45M | $6.0M | Debt yield |
| 6.5% | $6.5M | $6.33M | $6.0M | Debt yield |
| 7.5% | $6.5M | $5.72M | $6.0M | Debt service coverage (DSCR) |
| Test | Formula | Example threshold |
|---|---|---|
| Loan to value (LTV) | Loan ÷ value | at most 65% |
| Debt service coverage (DSCR) | NOI ÷ annual loan payment | at least 1.25x |
| Debt yield | NOI ÷ loan | at least 10% |
Text version of the graphic
A lender can size the loan three ways, and the smallest answer wins.
Each test caps the loan on its own. In this example, a higher rate makes the debt service coverage test the smallest.
Illustrative example, round numbers, not market data. Value $10.0M, NOI $600K, rate 6.5%, amortization 30 years.
Test 1. Loan to value (LTV). Loan ÷ value: at most 65%. Limits the loan to a share of the property value. Maximum loan $6.5M.
Test 2. Debt service coverage (DSCR). NOI ÷ annual loan payment: at least 1.25x. Tests whether income covers the loan payment. Maximum loan $6.33M.
Test 3. Debt yield. NOI ÷ loan: at least 10%. Ignores rate and amortization; reads income against the loan. Maximum loan $6.0M.
Rate, LTV, DSCR, Debt yield, Sets the loan. 5.0%: $6.5M, $7.45M, $6.0M, Debt yield sets the loan. 6.5%: $6.5M, $6.33M, $6.0M, Debt yield sets the loan. 7.5%: $6.5M, $5.72M, $6.0M, Debt service coverage (DSCR) sets the loan.
Side note. Construction and bridge loans may also be sized on loan to cost (LTC). Lender policy, recourse, reserves & sponsor strength also shape proceeds.
Illustrative example, round numbers, not market data.
Notes: Framework, not market data. Illustrative example with thresholds of 65% LTV, 1.25x DSCR and 10% debt yield on a 30-year amortizing loan. Real lender thresholds differ by lender, property type and market.
How to read this graphic
Read the table first. Each row holds the same property at one rate, and each column gives the largest loan one test allows. The lender takes the smallest figure, so find the lowest number in the row and note which test produced it. That test is the constraint to work on. Before approaching lenders, a sponsor can compare the sized loan with the amount the business plan needs and see how large the equity gap is.
The rate rows show why the binding test can change. LTV stays at $6.5M and debt yield at $6.0M, since neither uses the rate. The coverage test falls from $7.45M at 5.0% to $5.72M at 7.5%, passing $6.0M on the way, so it takes over at the higher rate. A sponsor can use that crossover to judge how much rate movement the loan size can absorb.
What the graphic does not show
The example uses a single property with round numbers. Its thresholds are illustrative, and real lenders set their own by property type and market. Readers could mistake the winning test for a prediction of the actual loan. The graphic omits loan to cost, which can size construction and bridge loans. Recourse and reserves, like lender policy and sponsor strength, also shape proceeds.