
Capital stack as payment priority, control & loss exposure
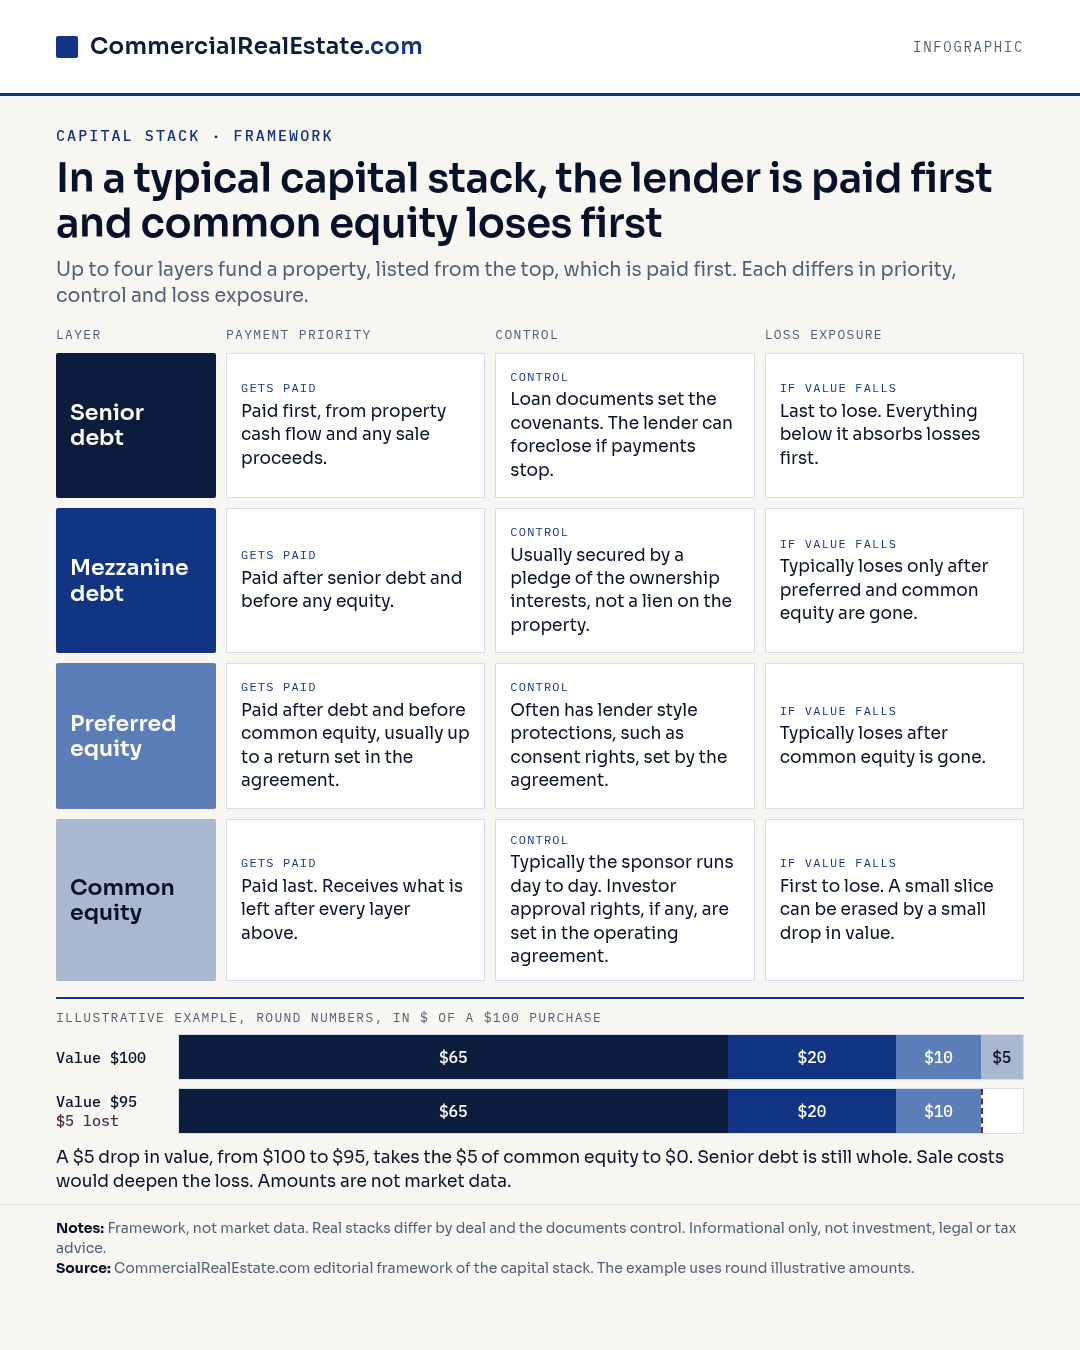
A capital stack ranks senior debt, mezzanine debt, preferred equity and common equity by who is paid first and who loses first. In the illustrative example, a drop from $100 to $95 leaves common equity with $0.
Data table
| Layer | Payment priority | Control | Loss exposure | Illustrative amount ($ of a $100 purchase) | After value falls to $95 |
|---|---|---|---|---|---|
| Senior debt | Paid first, from property cash flow and any sale proceeds. | Loan documents set the covenants. The lender can foreclose if payments stop. | Last to lose. Everything below it absorbs losses first. | $65 | $65 |
| Mezzanine debt | Paid after senior debt and before any equity. | Usually secured by a pledge of the ownership interests, not a lien on the property. | Typically loses only after preferred and common equity are gone. | $20 | $20 |
| Preferred equity | Paid after debt and before common equity, usually up to a return set in the agreement. | Often has lender style protections, such as consent rights, set by the agreement. | Typically loses after common equity is gone. | $10 | $10 |
| Common equity | Paid last. Receives what is left after every layer above. | Typically the sponsor runs day to day. Investor approval rights, if any, are set in the operating agreement. | First to lose. A small slice can be erased by a small drop in value. | $5 | $0 |
Text version of the graphic
In a typical capital stack, the lender is paid first and common equity loses first.
Up to four layers fund a property, listed from the top, which is paid first. Each differs in priority, control & loss exposure.
Senior debt. Payment priority: Paid first, from property cash flow and any sale proceeds. Control: Loan documents set the covenants. The lender can foreclose if payments stop. Loss exposure: Last to lose. Everything below it absorbs losses first.
Mezzanine debt. Payment priority: Paid after senior debt and before any equity. Control: Usually secured by a pledge of the ownership interests, not a lien on the property. Loss exposure: Typically loses only after preferred and common equity are gone.
Preferred equity. Payment priority: Paid after debt and before common equity, usually up to a return set in the agreement. Control: Often has lender style protections, such as consent rights, set by the agreement. Loss exposure: Typically loses after common equity is gone.
Common equity. Payment priority: Paid last. Receives what is left after every layer above. Control: Typically the sponsor runs day to day. Investor approval rights, if any, are set in the operating agreement. Loss exposure: First to lose. A small slice can be erased by a small drop in value.
Top of the stack is paid first and loses last. Illustrative example, round numbers, in $ of a $100 purchase. Value $100: Senior debt $65, Mezzanine debt $20, Preferred equity $10, Common equity $5. Value $95: Senior debt $65, Mezzanine debt $20, Preferred equity $10, Common equity $0, lost $5.
A $5 drop in value, from $100 to $95, takes the $5 of common equity to $0. Senior debt is still whole. Sale costs would deepen the loss. Amounts are not market data.
Layer, Payment priority, Control, Loss exposure.
Notes: Framework, not market data. Real stacks differ by deal and the documents control.
How to read this graphic
Read the stack from the lender down. Senior debt of $65 on a $100 purchase sits first in line for property cash flow and sale proceeds, and its loan documents set the covenants, so a capital raiser checking how much of the price is borrowed also learns how much control has been handed to the lender before any equity investor is asked for a dollar. Mezzanine debt of $20 and preferred equity of $10 follow, each priced for its place. Common equity of $5 takes whatever remains after the others.
A drop from $100 to $95 shows the point. The $5 of common equity falls to $0, and every layer above it stays whole. Approval rights for that small equity slice appear in the operating agreement, while consent rights appear in the preferred terms. Sale costs would deepen that loss.
What the graphic does not show
The graphic is a framework built on round illustrative amounts, and real stacks differ by deal. The loan documents and the operating agreement control who gets paid and who can act. A tidy ranking of four layers can mislead a reader into assuming every deal has all four. Sale costs would deepen the $5 loss, and the example leaves them out.