
The bank CRE credit cycle: standards, delinquencies, losses
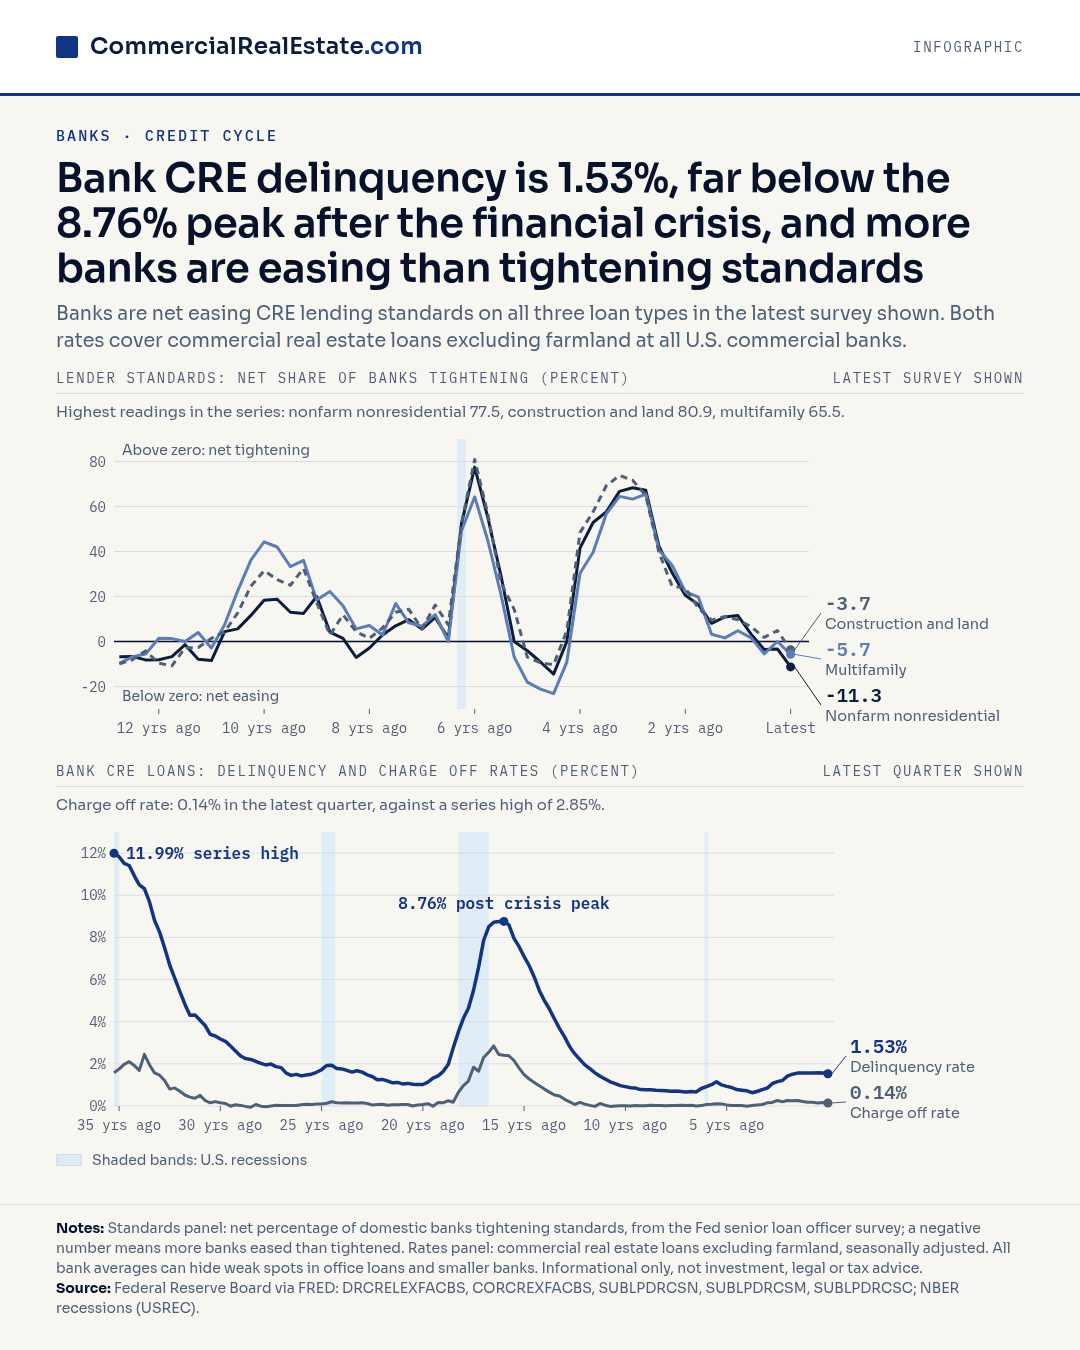
The bank CRE delinquency rate in the latest quarter shown is 1.53%, against a series high of 11.99% in the first quarter of the series and 8.76% in an earlier quarter shown on the chart. In the latest survey shown, banks net eased standards on nonfarm nonresidential (-11.3), multifamily (-5.7) and construction and land (-3.7) CRE loans.
Data table
The table lists the latest 24 of 143 rows. The full series is in the CSV download.
| Quarter | Delinquency rate (%) | Charge off rate (%) | Net tightening: nonfarm nonresidential | Net tightening: multifamily | Net tightening: construction and land |
|---|---|---|---|---|---|
| Quarter 120 | 1.15 | 0.11 | 55.1 | 44.9 | 56.7 |
| Quarter 121 | 1.00 | 0.10 | 29.2 | 20.8 | 26.1 |
| Quarter 122 | 0.93 | 0.05 | 0.0 | -6.9 | 14.3 |
| Quarter 123 | 0.88 | 0.02 | -4.1 | -18.1 | -7.0 |
| Quarter 124 | 0.78 | 0.02 | -9.1 | -21.2 | -9.4 |
| Quarter 125 | 0.75 | 0.02 | -14.5 | -23.2 | -10.3 |
| Quarter 126 | 0.72 | -0.01 | 0.0 | -9.2 | 4.7 |
| Quarter 127 | 0.63 | 0.03 | 41.5 | 30.3 | 48.4 |
| Quarter 128 | 0.69 | 0.05 | 52.9 | 39.7 | 57.6 |
| Quarter 129 | 0.78 | 0.07 | 57.6 | 56.7 | 69.2 |
| Quarter 130 | 0.85 | 0.15 | 66.7 | 64.5 | 73.8 |
| Quarter 131 | 1.06 | 0.17 | 68.3 | 63.3 | 71.7 |
| Quarter 132 | 1.16 | 0.26 | 67.2 | 65.5 | 64.9 |
| Quarter 133 | 1.21 | 0.20 | 42.4 | 40.7 | 39.7 |
| Quarter 134 | 1.42 | 0.26 | 30.6 | 33.9 | 24.6 |
| Quarter 135 | 1.51 | 0.25 | 20.6 | 22.2 | 23.8 |
| Quarter 136 | 1.56 | 0.26 | 16.4 | 19.7 | 14.8 |
| Quarter 137 | 1.57 | 0.22 | 8.1 | 3.2 | 9.5 |
| Quarter 138 | 1.57 | 0.18 | 10.9 | 1.6 | 11.1 |
| Quarter 139 | 1.57 | 0.18 | 11.5 | 4.8 | 9.7 |
| Quarter 140 | 1.58 | 0.14 | 3.3 | 1.6 | 6.6 |
| Quarter 141 | 1.56 | 0.17 | -3.6 | -5.5 | 1.8 |
| Quarter 142 | 1.53 | 0.14 | -3.3 | 0.0 | 4.9 |
| Quarter 143 | n/a | n/a | -11.3 | -5.7 | -3.7 |
Text version of the graphic
Bank CRE delinquency is 1.53%, far below the 8.76% peak after the financial crisis, and more banks are easing than tightening standards.
Banks are net easing CRE lending standards on all three loan types in the latest survey shown. Both rates cover commercial real estate loans excluding farmland at all U.S. commercial banks.
Highest readings in the series: nonfarm nonresidential 77.5, construction and land 80.9, multifamily 65.5.
Rates: delinquency 1.53% in the latest quarter; series high 11.99% in the first quarter of the series; 8.76% in an earlier quarter shown.
Charge off rate: 0.14% in the latest quarter, against a series high of 2.85%.
Standards in the latest survey: nonfarm nonresidential -11.3, multifamily -5.7, construction and land -3.7.
Notes: Standards panel: net percentage of domestic banks tightening standards, from the Fed senior loan officer survey; a negative number means more banks eased than tightened. Rates panel: commercial real estate loans excluding farmland, seasonally adjusted. All bank averages can hide weak spots in office loans and smaller banks.
How to read this graphic
Start with the right panel. Delinquency of 1.53% sits beside a series high of 11.99% and a post crisis peak of 8.76%, so the stock of troubled loans is small. Charge offs of 0.14% against a high of 2.85% show that few loans turn into realized losses. Then check the left panel, which reports the net share of banks tightening. Negative 11.3 for nonfarm nonresidential, and negative readings for the other two loan types, mean more banks are easing than tightening. The readings suggest easing lending standards for sponsors considering a refinancing.
Recessions are shaded, so you can compare each swing in the rates with the economic backdrop. Standards peaked at 80.9 for construction and land and 77.5 for nonfarm nonresidential. Watch whether the lines cross zero again. Multifamily tightening reached 65.5 at its highest, a reminder that easing can reverse quickly.
What the graphic does not show
The 1.53% delinquency rate and 0.14% charge off rate are averages across all U.S. commercial banks, and the notes warn that averages can hide weak spots in office loans and smaller banks, which the national line cannot show on its own. The survey measures lender attitude and reports net percentages, so it says little about the terms on any single loan. Treat the page as context for underwriting.