
Who holds US commercial and multifamily mortgage debt
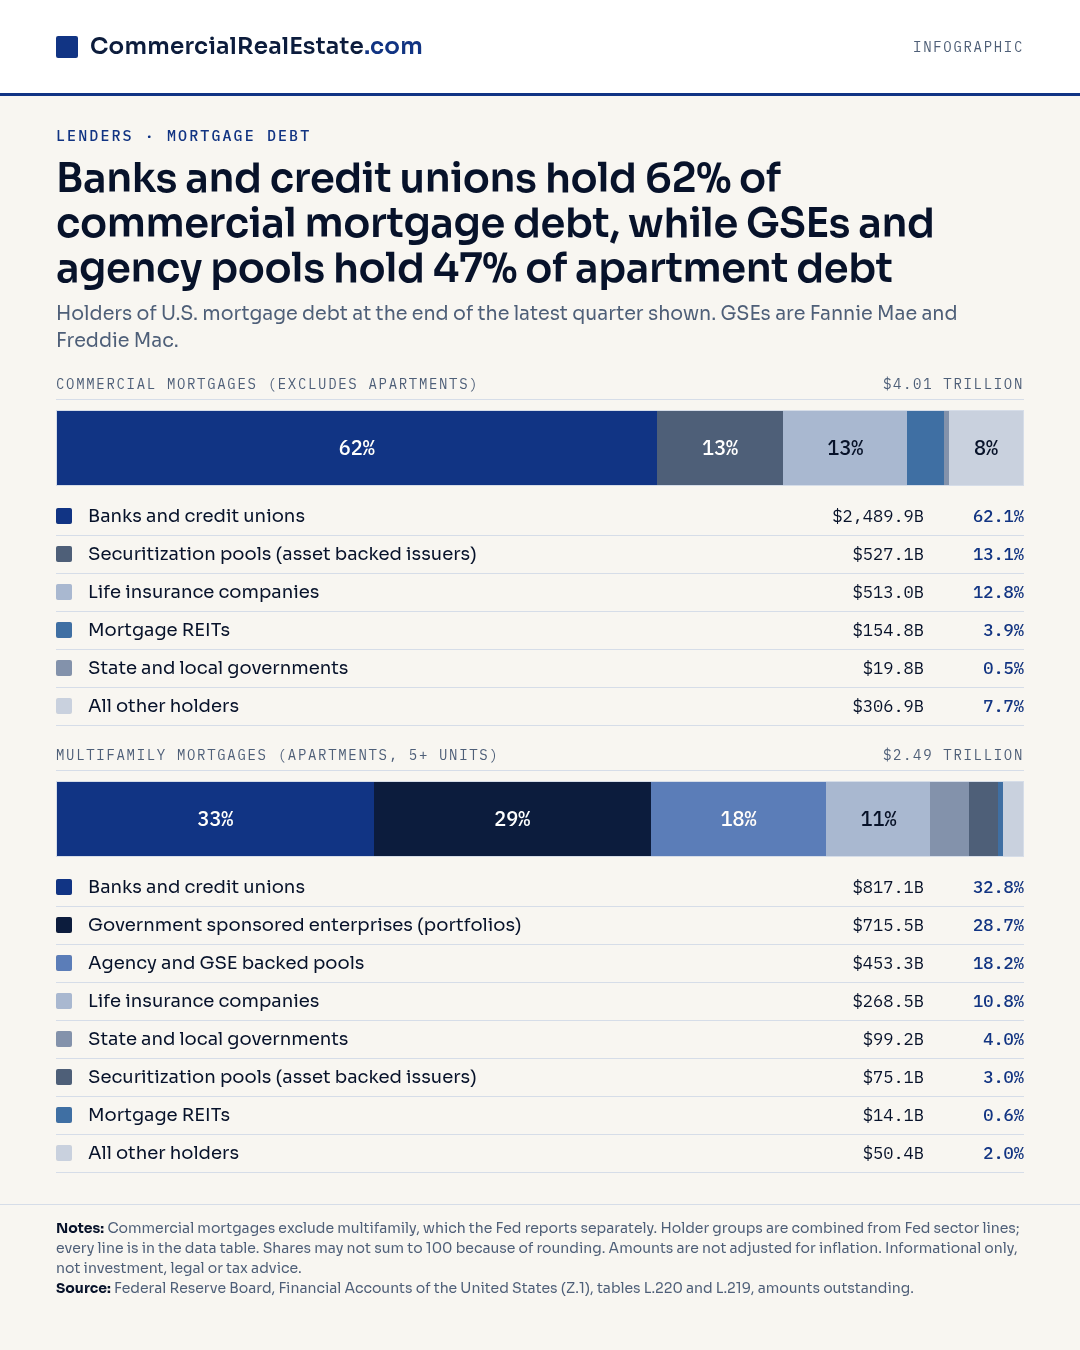
Banks and credit unions hold 62% of the $4.01 trillion in commercial mortgages. GSEs and agency pools hold 47% of the $2.49 trillion in apartment mortgages, and banks hold 33%.
Data table
| Holder group | Commercial mortgages ($ billions) | Share | Multifamily mortgages ($ billions) | Share |
|---|---|---|---|---|
| Banks and credit unions | 2,489.9 | 62.1% | 817.1 | 32.8% |
| Life insurance companies | 513.0 | 12.8% | 268.5 | 10.8% |
| Government sponsored enterprises (portfolios) | n/a | n/a | 715.5 | 28.7% |
| Securitization pools (asset backed issuers) | 527.1 | 13.1% | 75.1 | 3.0% |
| Agency and GSE backed pools | 0.0 | 0.0% | 453.3 | 18.2% |
| Mortgage REITs | 154.8 | 3.9% | 14.1 | 0.6% |
| State and local governments | 19.8 | 0.5% | 99.2 | 4.0% |
| All other holders | 306.9 | 7.7% | 50.4 | 2.0% |
| Total | 4,011.5 | 100.0% | 2,493.4 | 100.0% |
Text version of the graphic
Banks and credit unions hold 62% of commercial mortgage debt, while GSEs and agency pools hold 47% of apartment debt.
Holders of U.S. mortgage debt in the latest quarter shown. GSEs are Fannie Mae and Freddie Mac.
Commercial mortgages $4.01 trillion: Banks and credit unions $2.49 trillion (62.1%); Securitization pools (asset backed issuers) $527.1B (13.1%); Life insurance companies $513.0B (12.8%); Mortgage REITs $154.8B (3.9%); State and local governments $19.8B (0.5%); All other holders $306.9B (7.7%).
Multifamily mortgages $2.49 trillion: Banks and credit unions $817.1B (32.8%); Government sponsored enterprises (portfolios) $715.5B (28.7%); Agency and GSE backed pools $453.3B (18.2%); Life insurance companies $268.5B (10.8%); State and local governments $99.2B (4.0%); Securitization pools (asset backed issuers) $75.1B (3.0%); Mortgage REITs $14.1B (0.6%); All other holders $50.4B (2.0%).
Notes: Commercial mortgages exclude multifamily, which the Fed reports separately. Holder groups are combined from Fed sector lines; every line is in the data table. Shares may not sum to 100 because of rounding. Amounts are not adjusted for inflation.
How to read this graphic
A sponsor reading this graphic first looks at who funds the property type. Commercial mortgages, which exclude apartments, total $4.01 trillion, and banks and credit unions carry $2.49 trillion of that, or 62.1%, and securitization pools hold $527.1B and life insurance companies hold $513.0B. Apartment loans also total $2.49 trillion. Banks and credit unions hold $817.1B of them, while GSE portfolios hold $715.5B. Agency and GSE backed pools add another $453.3B. That split tells a capital raiser which lender relationships matter most before a deal reaches a signed term sheet.
Read the apartment side first for agency exposure. GSEs are Fannie Mae and Freddie Mac, and their portfolios plus agency backed pools hold 28.7% and 18.2%. Check the data table before quoting shares, because holder groups are combined from the Fed sector lines and rounding may leave totals off 100.
What the graphic does not show
The chart is a snapshot of amounts outstanding at one date. It says nothing about loan maturities or pricing. A 62.1% bank share of the $4.01 trillion commercial total does not mean banks will lend on your asset. Amounts are not adjusted for inflation, and the apartment figure covers buildings of 5+ units only.