
What is being built: data centers versus offices
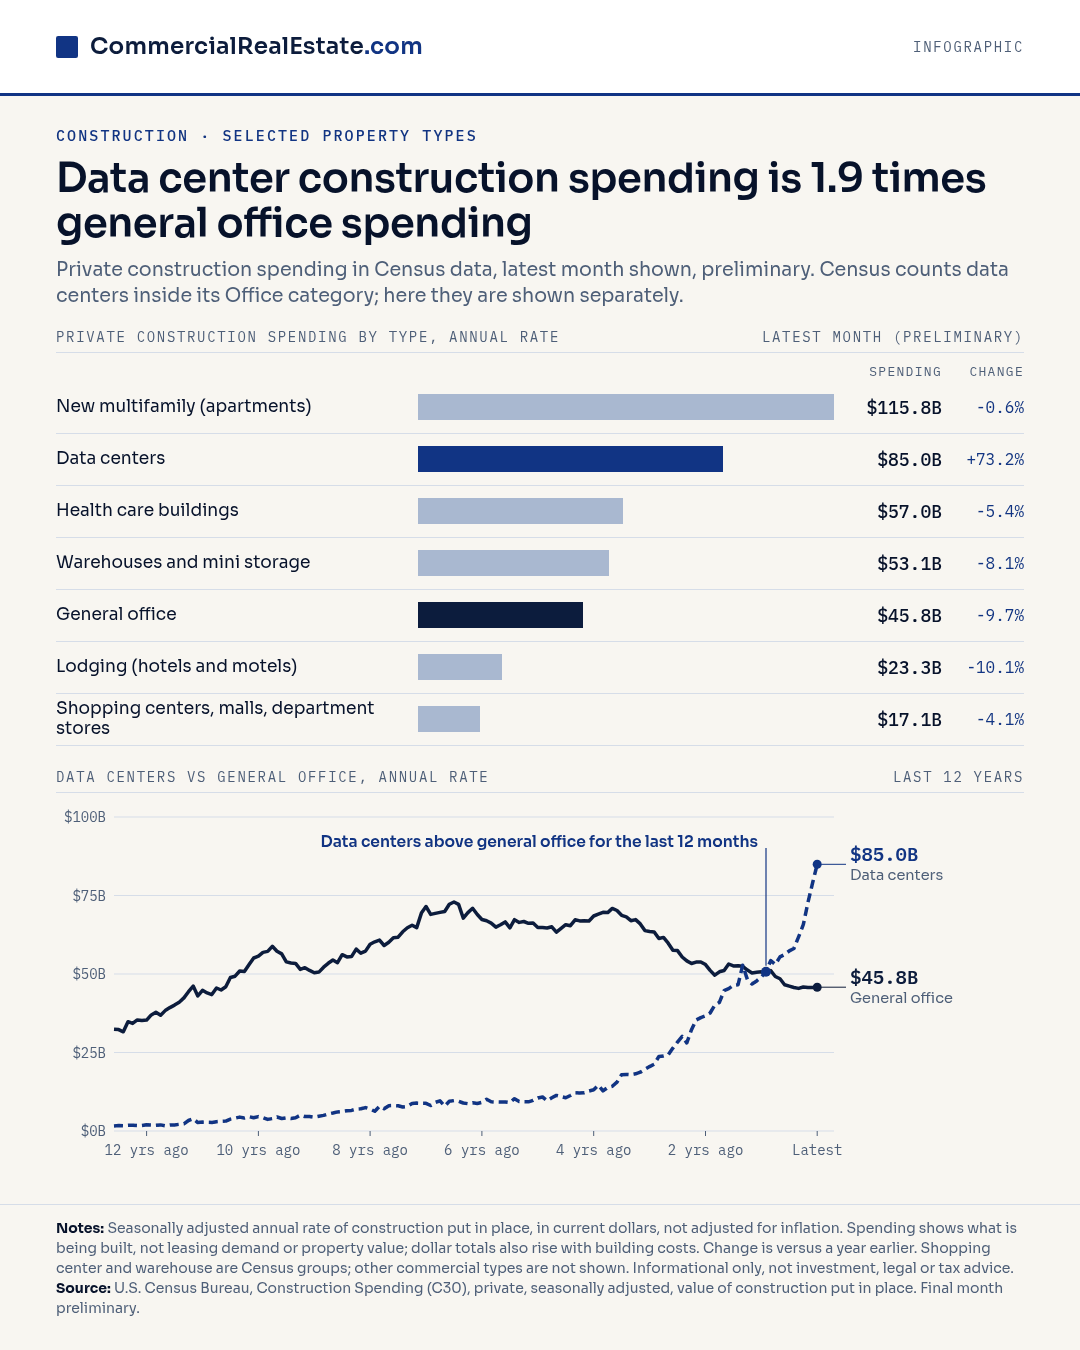
Data centers account for $85.0 billion of annual rate construction spending in the latest month shown (preliminary), 1.9 times general office at $45.8 billion. Data center spending has stayed above general office for the most recent year shown.
Data table
The table lists the latest 24 of 152 monthly rows. The full series is in the CSV download.
| Month | Data center spending ($ millions, annual rate) | General office spending ($ millions, annual rate) |
|---|---|---|
| Month 129 | 37,576 | 51,144 |
| Month 130 | 40,048 | 49,609 |
| Month 131 | 40,951 | 50,701 |
| Month 132 | 44,703 | 51,109 |
| Month 133 | 45,341 | 53,185 |
| Month 134 | 46,409 | 52,577 |
| Month 135 | 46,593 | 52,633 |
| Month 136 | 52,818 | 52,451 |
| Month 137 | 48,210 | 51,243 |
| Month 138 | 46,850 | 50,328 |
| Month 139 | 47,810 | 50,547 |
| Month 140 | 49,052 | 50,724 |
| Month 141 | 50,700 | 50,056 |
| Month 142 | 54,260 | 51,064 |
| Month 143 | 53,043 | 49,192 |
| Month 144 | 55,461 | 48,457 |
| Month 145 | 56,211 | 46,552 |
| Month 146 | 57,361 | 46,148 |
| Month 147 | 58,121 | 45,697 |
| Month 148 | 61,859 | 45,412 |
| Month 149 | 65,688 | 45,846 |
| Month 150 | 72,695 | 45,667 |
| Month 151 | 79,007 | 45,745 |
| Month 152 (preliminary) | 84,950 | 45,809 |
Text version of the graphic
Data center construction spending is 1.9 times general office spending.
Private construction spending in Census data, latest month shown, preliminary. Census counts data centers inside its Office category; here they are shown separately.
New multifamily (apartments): $115.8B, -0.6% from a year earlier.
Data centers: $85.0B, +73.2% from a year earlier.
Health care buildings: $57.0B, -5.4% from a year earlier.
Warehouses and mini storage: $53.1B, -8.1% from a year earlier.
General office: $45.8B, -9.7% from a year earlier.
Lodging (hotels and motels): $23.3B, -10.1% from a year earlier.
Shopping centers, malls, department stores: $17.1B, -4.1% from a year earlier.
Data centers $85.0B against general office $45.8B, 1.9 times. Data centers have stayed above general office for the most recent year shown.
Notes: Seasonally adjusted annual rate of construction put in place, in current dollars, not adjusted for inflation. Spending shows what is being built, not leasing demand or property value; dollar totals also rise with building costs. Change is versus a year earlier. Shopping center and warehouse are Census groups; other commercial types are not shown.
How to read this graphic
Start with the ratio. Data center construction runs at $85.0B a year against $45.8B for general office, or 1.9 times, and the line has held above office for a sustained run. A sponsor sizing a niche can compare that gap with the other bars, where only new multifamily at $115.8B is larger. Over a year, data centers rose 73.2% while general office fell 9.7%, so builders are putting new capital into data centers and pulling back on offices. That shapes how you frame competing supply in a written underwriting memo.
Read the ratio as a cue, then check the base. Tenant or lender backing, local power availability and zoning are factors sponsors consider when evaluating the thesis. Office at $45.8B is still a large pipeline, so a 9.7% decline does not make it close to empty.
What the graphic does not show
The figures measure dollars spent on construction in progress and say nothing about leasing or values, and a dollar total can rise simply because materials and labor cost more, since nothing here is adjusted for inflation. Data centers are shown apart from the office category that normally holds them, so general office at $45.8B is narrower than the headline office number. The latest month is preliminary, so 1.9 times may shift.